💚 Service Health Monitoring
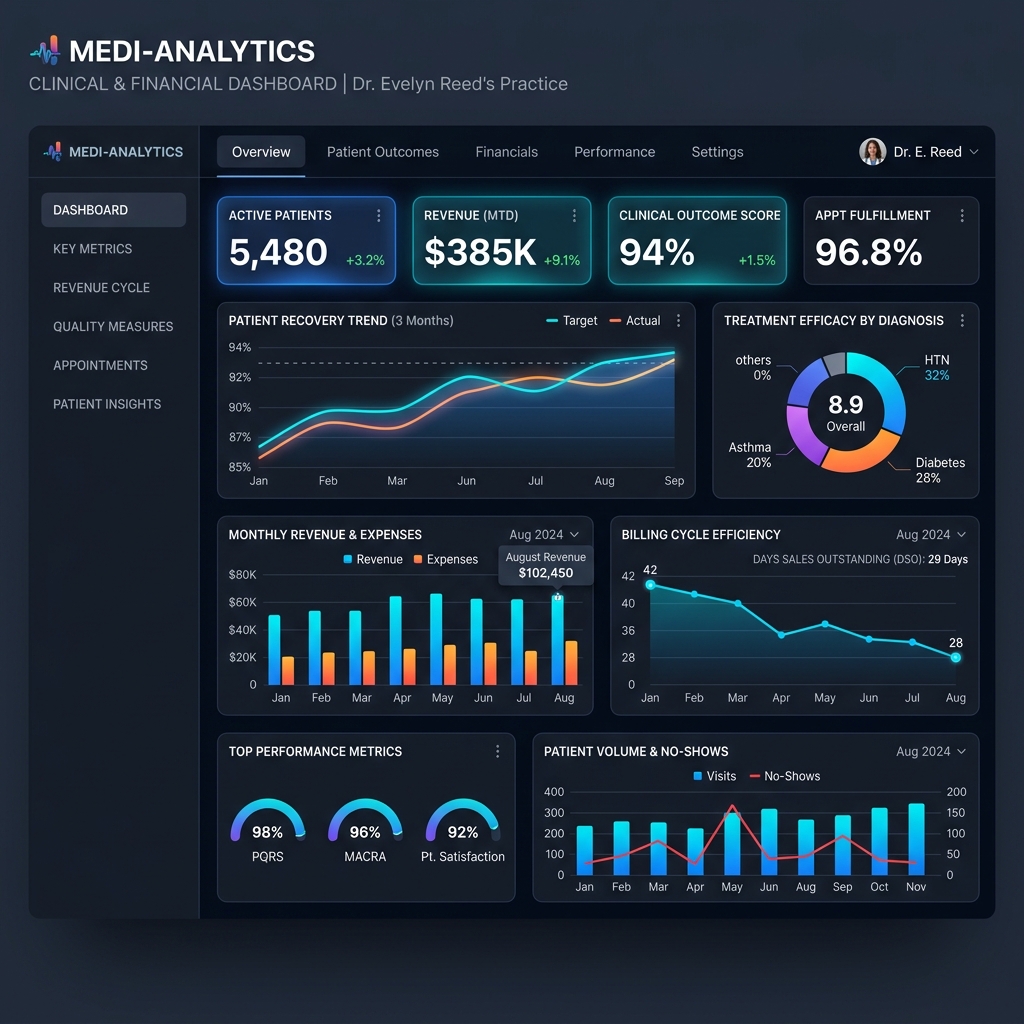
Internal monitoring of every Synalux dependency (database, OAuth providers, LiveKit, Deepgram Aura, Anthropic, Gemini, OpenRouter, Stripe). Failures email the admin team and surface a status banner to affected users.
🩺 What's Monitored
- Database — Postgres / Supabase reachability, replication lag, RLS policy presence.
- OAuth providers — Google / Microsoft / Telegram / Meta token-refresh path health.
- LiveKit SFU — TURN reachability, room creation success rate.
- TTS — Deepgram Aura latency + error rate; Azure Neural fallback availability.
- AI — Anthropic, Gemini, OpenRouter latency + 5xx rate; trips fallback chain when degraded.
- Stripe — checkout + webhook ingress.
- Storage — Supabase Storage object writes.
- Mail / SMS / chat providers — incoming webhook acceptance rate.
🚨 Alert Path
- Email to admin distribution list when a dependency drops below SLO.
- In-app banner to affected users when their experience is degraded — e.g. "Voice cloning is temporarily unavailable; standard voices still work."
- Status page at
synalux.ai/status(planned) for public visibility.
🛠️ Critical Bug History
- Supabase RLS-disabled critical alert — caught when a migration accidentally dropped RLS policies on the
patientstable. Auto-detected within 60 seconds; admins paged; rolled back same hour.
🏗️ Architecture
GET  /api/v1/cron/services-health            Aggregate health snapshot (cron-driven)
GET  /api/v1/cron/tts-health                TTS provider latency + availability
GET  /api/v1/cron/chain-health-nightly      Nightly deep probe of all dependencies
GET  /api/v1/integrations/chain-health      Integration health dashboard
Probes run every 60 seconds via Vercel Cron; results written to service_health_checks with TTL retention.
💳 Plans
Always-on for every workspace. Admin-tier sees the full dashboard; users see degraded-feature banners only.